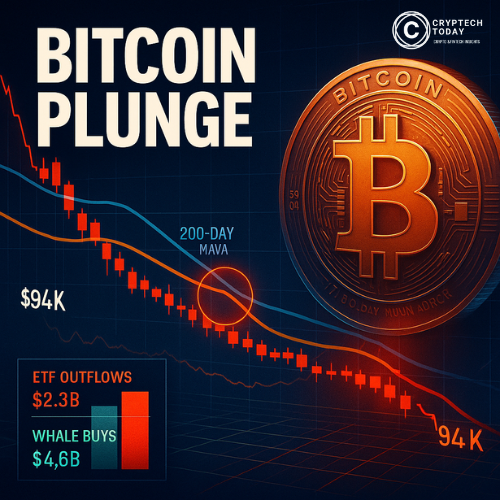
Bitcoin plunged below $94,000 on November 17, 2025, erasing most of 2025’s gains and dragging the market into “extreme fear.” The Crypto Fear & Greed Index sits near 10, liquidity is thin, and more than $19 billion of leveraged crypto positions were liquidated after a policy shock in October. Yet behind headlines of panic, large holders quietly bought: on-chain trackers show about $4.6 billion of BTC was moved into long-term wallets in one week, suggesting serious capital is taking advantage of distress pricing.
This is not a clean story of capitulation or recovery. It’s a recalibration: leverage was purged, retail fled, and institutions sorted between tactical sellers and strategic buyers. The next two weeks will decide whether this is a local bottom or the opening of a deeper correction.
The shock that triggered the purge
The immediate catalyst was a policy shock on October 10, 2025. An unexpected tariff escalation sent risk assets reeling; crypto’s concentrated leverage then turned a macro news event into a market-wide purge. Within 24 hours, more than $19 billion in positions were liquidated across venues, the largest single-day crypto liquidation on record. Futures, perpetuals, and margin stacks unravelled as liquidity providers widened spreads, triggering forced selling.
Two features amplified the fall:
- Concentrated long exposure. A large share of open interest was long, so downward pressure translated quickly into violent sell orders.
- Liquidity withdrawal. Market makers pulled quotes, creating order-book holes that made liquidation engines hit extreme, dislocated prices.
- Wrapped-stable and venue-specific liquidity strains (notably some synthetic dollars briefly losing their peg on single exchanges) accelerated panic sales and collateral shortfalls.
Who sold — and who bought
The sell-side looked like a cross-section of panic: retail margin accounts, overleveraged funds, and some corporate treasury positions that chose to de-risk. On-chain data showed unusually high outflows from long-term holder wallets, amounting to about 815,000 BTC distributed in short order, suggesting even patient holders reacted to the liquidity shock.
However, a countervailing flow emerged within days: huge entities and “permanent” wallets accumulated significantly. The week of November 13 saw over 45,000 BTC (approximately $4.6B) placed into huge cold wallets, making it the second-largest accumulation week of 2025. Major institutional investors, such as corporate treasuries and endowments, boosted their exposure. Exchange reserves declined across major venues, indicating that buyers were withdrawing coins from the market and into custody.
The fundamental divergence matters: ETFs recorded net outflows in November (about $2.3B), consistent with tactical profit-taking and rebalancing into safer assets, while accumulation by whales implies selective, conviction-led buying.
Technical picture: the death cross and the $90k decision point
Bitcoin confirmed a death cross (50-day MA below 200-day MA), a bearish signal. Recent cycles saw similar crosses mark local lows, not prolonged downturns; these signals often reflect past price damage and lag future market direction.
Key levels to watch:
- Current support: $93k–$95k (short-term demand zone)
- $90k is the structural line: a daily close below risks a move toward $84k; in a stressed scenario, $70k could follow.
- Near-term resistance: $96k–$100k — a sustained close above $100k would restore bullish structure.
Momentum indicators are deeply oversold (RSI near or below 35 on short timeframes), and some weekly hidden bullish divergences are emerging as classic exhaustion signals that can precede relief rallies. Still, thin volumes and concentrated liquidity make false moves common; conviction needs confirmation by price and flow.
Macro overlay: Fed, politics, and the liquidity frame
Macro forces matter. The U.S. government shutdown in early October and ongoing Fed balance-sheet dynamics created a data vacuum and liquidity uncertainty. Even after a modest Fed easing was priced in, markets remain sensitive to guidance: any hawkish pivot or negative data surprise could quickly drain risk appetite.
That macro backdrop helps explain why institutional players are bifurcated: some are taking profits into short-term Treasuries and cash, others are treating the dip as a buying opportunity relative to production costs and long-term models.
Market mechanics that changed the playbook
The October unwind highlighted three structural risks:
- Leverage concentration — perpetual funding and retail margin exposure still amplify moves.
- Liquidity fragility — market-making obligations evaporate under stress unless exchanges enforce minimum provision standards.
- Derivative feedbacks — options expiries, ADL mechanisms, and insurance fund erosion can magnify realised losses beyond margin balances.
Regulators and exchanges will likely debate structural fixes: better margining, mandatory liquidity commitments, circuit breakers coordinated across venues, and more resilient insurance/clearing frameworks that can contain cascading price moves.
Trading framework: practical ways to navigate now
Given the mixed signals, practical, rules-based approaches are essential.
For long-term investors (HODLers):
- Dollar-cost average into the $93k–$95k zone and ladder buys down to $88k–$84k.
- Use stablecoins as dry powder to add in staged tranches.
- Consider partial recoveries: once principal is recovered (e.g., BTC > $100k), take enough profit to de-risk core exposure.
For traders (short-term):
- Respect the “no-trade” zone between $90k–$98k unless clear directional confirmation.
- Shorts can be attempted on rallies into $96k–$100k with tight stops above $101k.
- Employ small position sizes (≤2–3% risk), strict stops, and defined profit targets.
Risk rules (non-negotiable):
- Position-size conservatively; never risk more than 2–3% of capital on a single directional bet.
- Use stop-losses and pre-defined exit plans.
- Keep liquidity (stablecoins) to buy legitimate breakdowns, not to chase rebounds.
Options market structure also offers hedging: cash-secured puts at strikes near $90k–$92k can generate premium while committing to buy at a lower basis if exercised.
The narrative test: capitulation, rotation, or a structural reset?
Three plausible scenarios:
- Bullish repair (base case): $90k holds → institutional accumulators and ETFs stabilise flows → BTC retests $110k–$126k over months.
- Choppy consolidation: BTC trades in $88k–$105k for weeks as macro clarity and fund flows reset.
- Deeper correction (bear case): $90k breaks → liquidation cascades and distressed selling push price toward $70k.
Probability leans toward the first two scenarios given the selective accumulation and historical pattern, but a decisive close below $90k would materially raise the probability of the bear case.
What this cycle teaches investors and exchanges
- Trade the market you have, not the one you want. Risk management beats bravado; leverage is the primary enemy.
- Institutional flows are nuanced. ETF redemptions aren’t a wholesale loss of faith; they can be tactical rebalancing. Large-wallet accumulation often signals conviction, but concentration risk remains.
- Market structure needs repair. Exchanges and regulators should consider rules that reduce flash liquidity withdrawal and create coordinated circuit breakers.
Final thought
Bitcoin’s descent to roughly $94k is a major inflexion: it flushed speculative leverage and revealed market fragilities, but it also created an institutional entry point for patient buyers. Whether this marks a durable bottom or the opening act of a deeper correction depends on a few clear, measurable things: ETF flows, exchange reserve trends, and whether $90k holds. For now, the call is pragmatic: respect the technical damage, trade with disciplined sizing, and let institutional behaviour and price action, not hope, decide your allocations.


